Work Logger


![]()
This project automates the tracking of employee work hours. It replaces manual data entry with a robust Python-driven system that stores information in a relational database (SQL) and generates visual performance reports.
📸 Screenshots
🔎 The Data Pipeline (Step-by-Step)
- Generation (app.py / Initialization)
- Action: Uses the Faker library to create 50 fictional employees.
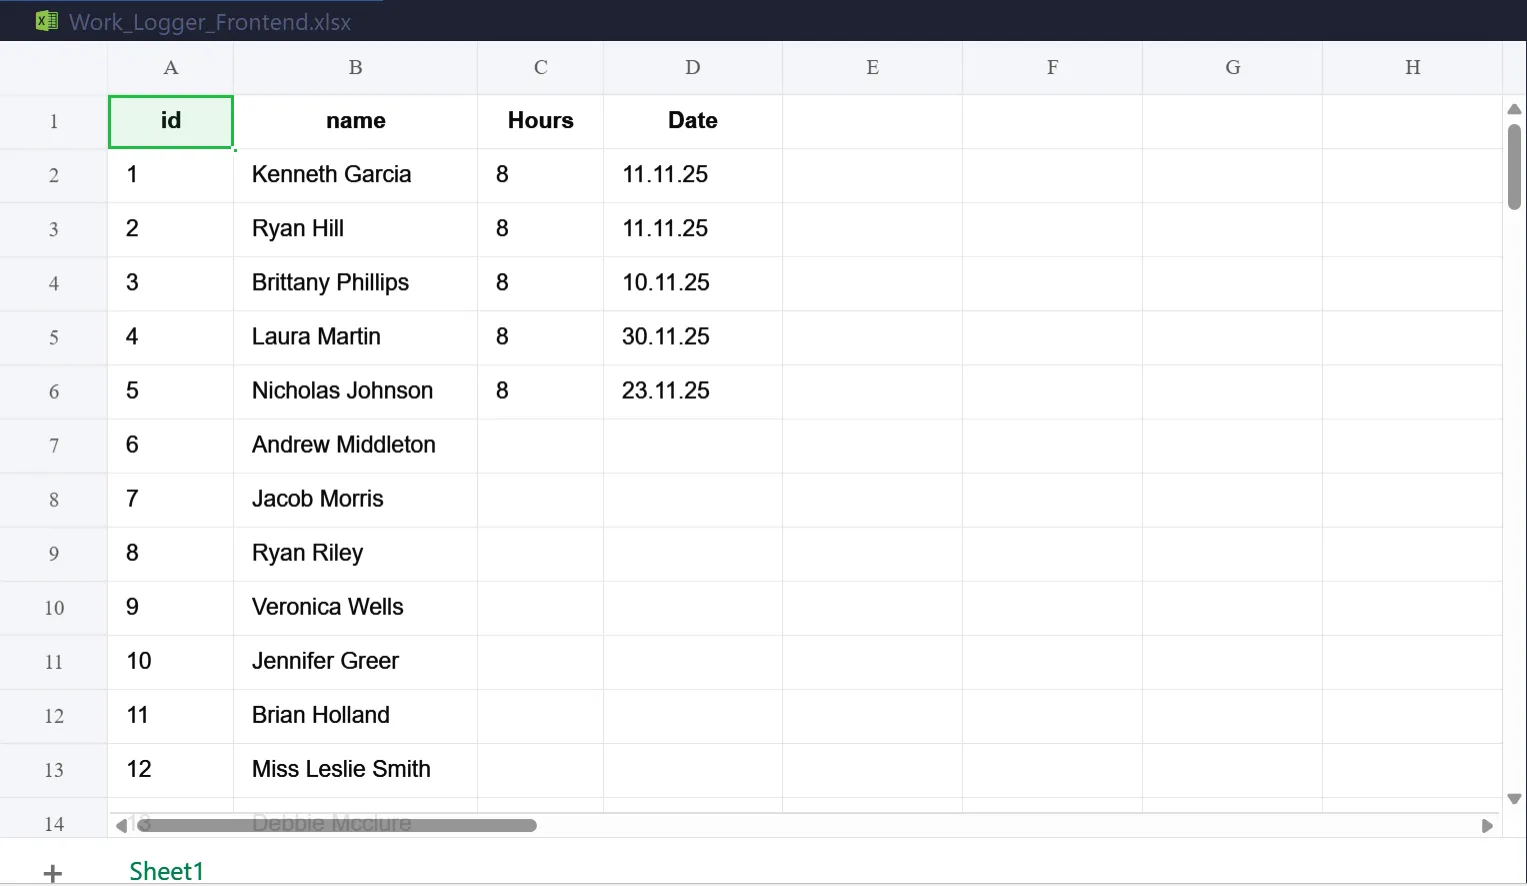
- Output: Saves these employees to a SQL database and exports a starter Excel template (WorkLoggerFrontend.xlsx) for the user to fill out.
- Input (User Action in Excel)
- Action: The user opens the Excel file, adds "Hours" and "Date" columns, and inputs the daily work logs.
- Result: Provides a familiar, user-friendly interface for data entry.
Ingestion & Storage (sync_data.py)
- Action: Reads the Excel file using pandas, cleans the headers (removing spaces/case sensitivity), and maps the data to the SQL structure defined in models.py.SQL
- Logic: Rows are moved from a "flat" spreadsheet into a relational SQL table (worklogs), linking every hour logged to a specific employeeid.
Verification (check_db.py)
- Action: A utility script that queries the SQLite database directly.
- Purpose: Confirms the data has been "committed" to the database and is no longer just sitting in a temporary Excel file.
Visualization (generate_report.py)
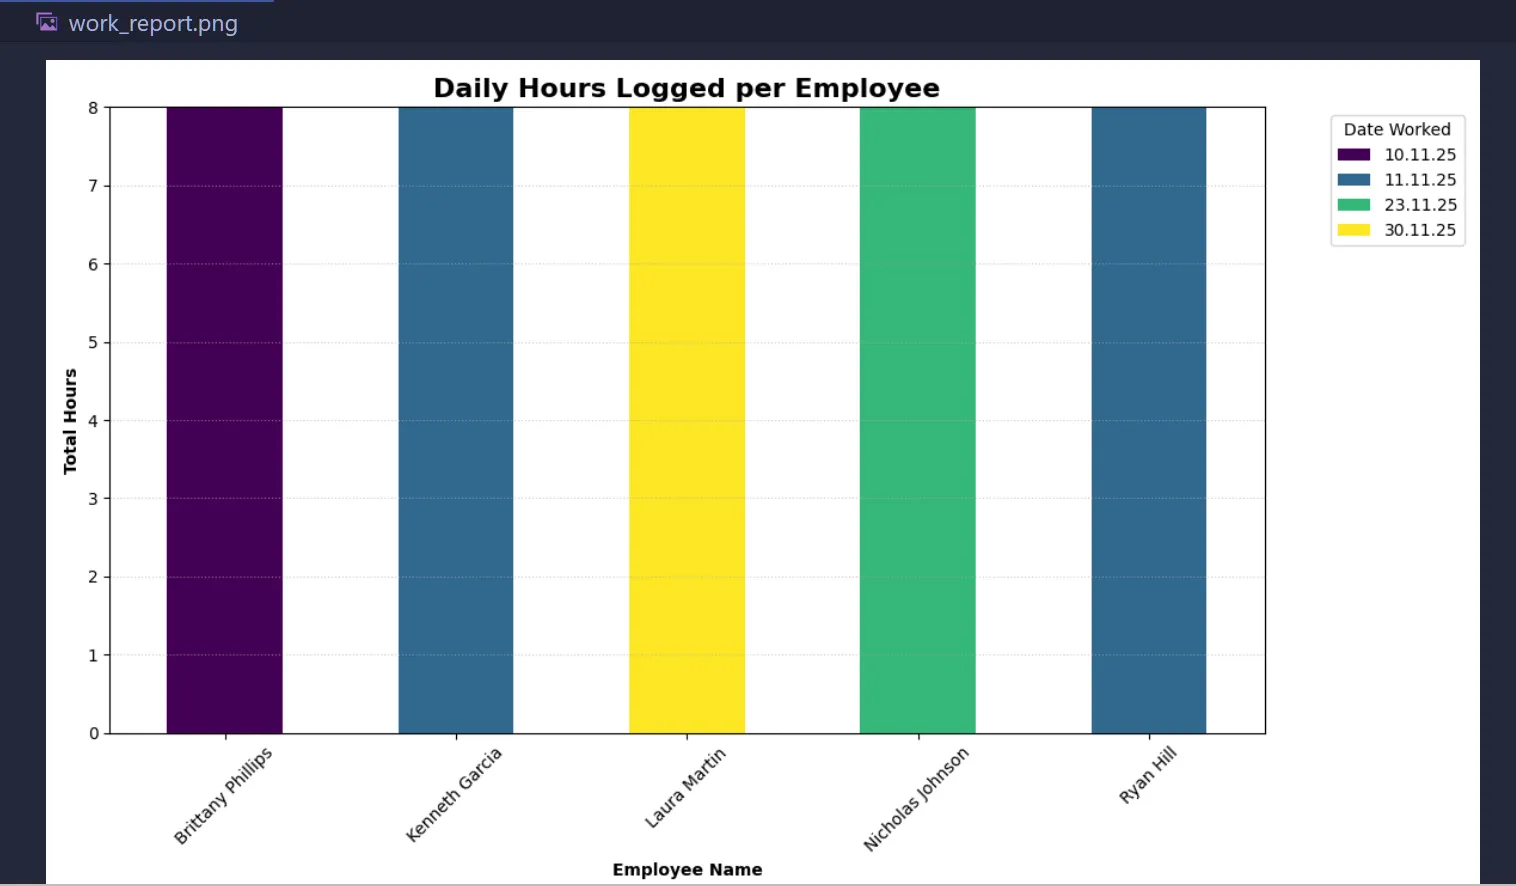
- Action: Uses a SQL JOIN to combine employee names with their hours, then uses matplotlib to pivot the data.
Output:
- Generates a stacked bar chart (work_report.webp) showing total hours worked per person, segmented by date.
Summary
- models.py Main Architecture - The blueprint defining the SQL tables and data rules.
- sync_data.py The Bridge - Reads Excel, cleans it, and "syncs" it to the database.
- check_db.py The Audit - A quick look inside the database to verify success.
- generate_report.py The Analytics - Turns raw numbers into a visual, date-aware bar chart.
Setup the Environment
- Ensure your virtual environment is active and libraries are installed:
# Activate venv (Windows)
.\venv\Scripts\activate
Install dependencies
pip install pandas sqlalchemy openpyxl matplotlib
Prepare the Data
Open WorkLoggerFrontend.xlsx in the Excel Desktop App.
Ensure you have columns for id, name, Hours, and Date.
Enter your work logs, Save, and Close Excel (Crucial to avoid Permission Errors).
Sync to Database
- Run the sync script (sync_data.py) to move your Excel rows into the SQL database:
python sync_data.py
- Check for the success message: 🚀 Success! Synced X rows to SQL.
Verify (Optional)
- If you want to see the raw data sitting inside the SQL table:
python check_db.py
Generate the Visual Report
- Create the stacked bar chart to analyze the hours:
python generate_report.py
- This will pop up a window with your graph and save a file named work_report.webp.
⚠️ Common Troubleshooting
Permission Denied: Ensure Excel is closed before running sync_data.py.
KeyError 'Hours': Check that your Excel header is exactly "Hours" (case-sensitive) and in the very first row.
ModuleNotFoundError: Ensure you are running the scripts from inside your venv.
📁 Project Structure
data_analysis/
├── venv/                           # Python Virtual Environment
├── models.py                       # Database architecture (The Blueprint)
├── sync_data.py                    # Excel-to-SQL bridge (The Worker)
├── generate_report.py              # Chart generator (The Visualizer)
├── check_db.py                     # Database inspector (The Auditor)
├── work_logger.db                  # The SQLite database file (Auto-generated)
└── Work_Logger_Frontend.xlsx       # The Excel entry sheet
🖥️ Tech Stack:
- Python
- Faker
- SQLite (via SQLAlchemy ORM)
- Data Handling: PandasVisuals:
- Matplotlib PyPlot Interface: Bar Chart
- Microsoft Excel (.xlsx)
🛣️ Roadmap Features
[ ] Automated Email Reports Integrate a Python mail library (like smtplib) to automatically email the work_report.webp graph to a manager every Friday afternoon.
[ ] Interactive Web Dashboard Move the project from static Matplotlib images to an interactive web app using Streamlit, allowing users to filter by employee or date range in a browser.
[ ] Cloud Deployment Migrate the local SQLite database to a cloud database (like PostgreSQL) so multiple people can log hours from different computers at the same time.
📑 Notes
End-to-End ETL Pipeline: - Extracted data from Excel, - Transformed it using Python/Pandas, and - Loaded it into a Relational Database (SQL).
--
- Built by Roy Peters 😁
