Text2Flow


A lightweight, high-performance web application that converts simple text syntax into professional SVG/PNG flowcharts. Built with FastAPI and powered by the Graphviz visualization engine.
✨ Features
Instant Rendering: Convert text to diagrams in real-time.
Simple Syntax: No complex drag-and-drop; just type A -> B.
Clean API: Decoupled backend for programmatic diagram generation.
Responsive UI: Minimalist editor with live preview.
📸Screenshots
| View 3 | View 2 | View 1 |
 |
 |
 |
🚀 Getting Started
Prerequisites - Python 3.8+
Graphviz Software: This app requires the Graphviz binaries to be installed on your system.
Windows: Download here. Ensure you check "Add Graphviz to system PATH" during installation.
macOS: brew install graphviz
Linux: sudo apt install graphviz
⚙️ Installation
Clone the repository:
git clone https://github.com/yourusername/text2flow.git
cd text2flow
Create and activate a virtual environment:
python -m venv venv
# Windows
.\venv\Scripts\activate
# macOS/Linux
source venv/bin/activate
Install dependencies:
pip install fastapi uvicorn graphviz jinja2 python-multipart pyragify
Run the server:
uvicorn app.main:app --reload
Open your browser to http://127.0.0.1:8000.
📝 How to Use
The editor uses a simple arrow-based syntax (->) to define relationships between nodes.
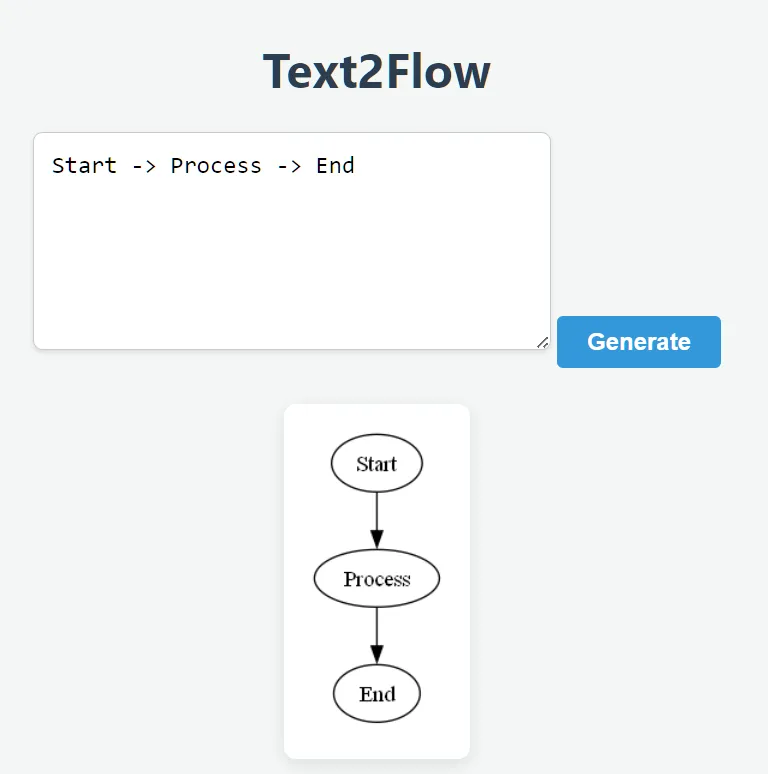
Basic Flow
Plaintext
Start -> Process -> End
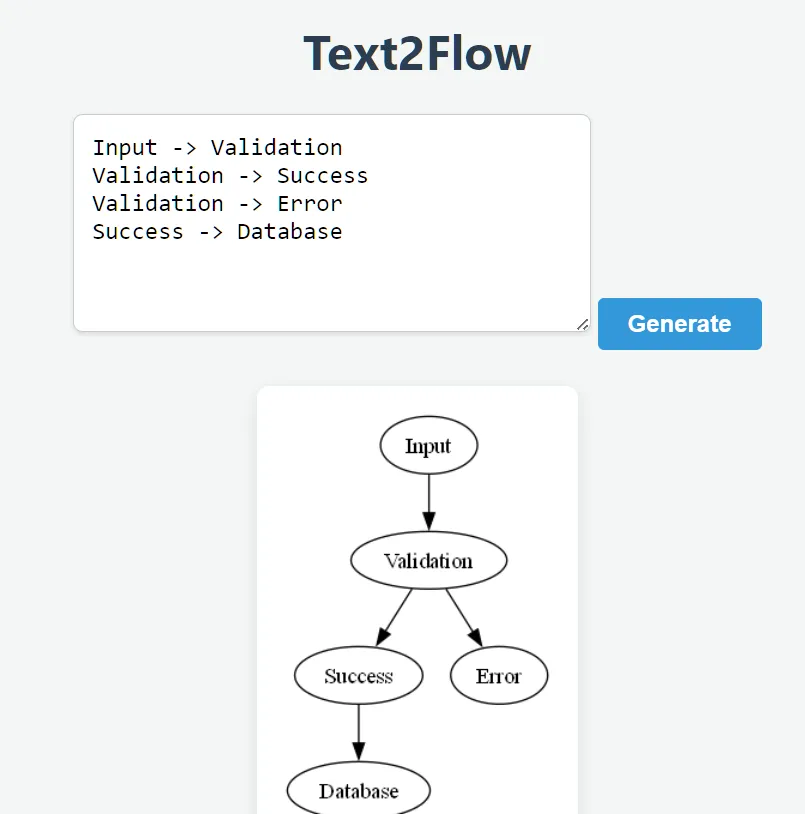
Branching & Decisions
You can create multiple paths by starting a new line with the same node name.
Input -> Validation
Validation -> Success
Validation -> Error
Success -> Database
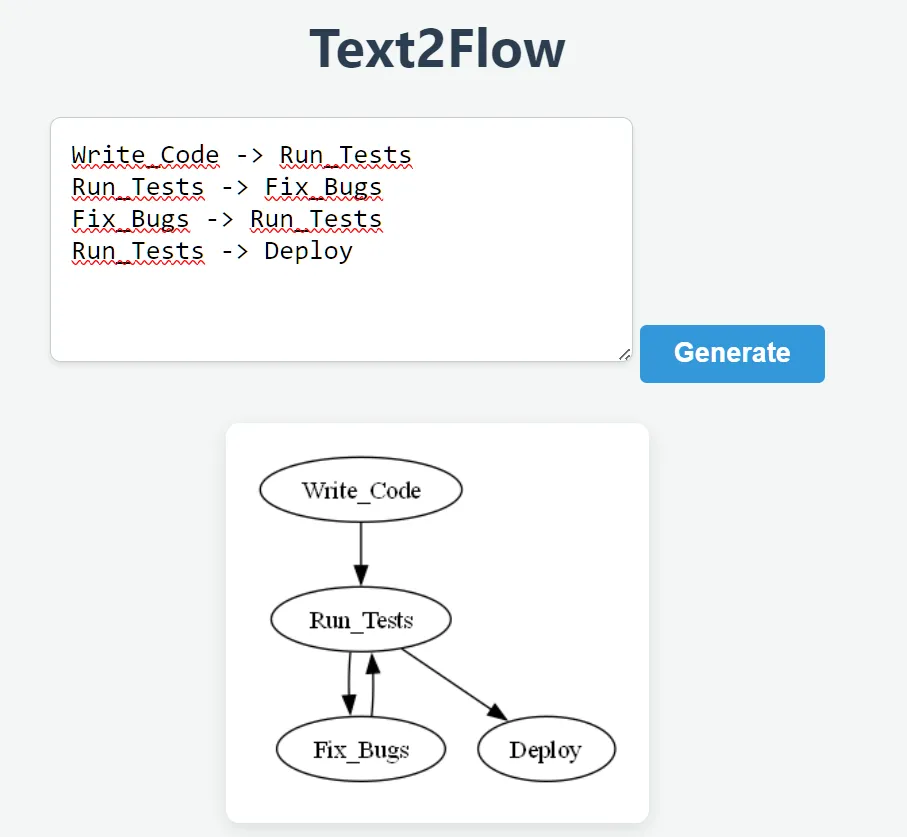
Feedback Loops
Graphviz automatically handles the layout for circular logic.
Write_Code -> Run_Tests
Run_Tests -> Fix_Bugs
Fix_Bugs -> Run_Tests
Run_Tests -> Deploy
🛠️ Project Structure
text2flow/
├── app/
│   ├── main.py
│   ├── routers/
│   │   └── api.py
│   ├── services/
│   │   ├── parser.py
│   │   ├── renderer.py
│   │   └── logger.py
│   ├── static/
│   │   ├── css/style.css
│   │   └── js/app.js
│   └── templates/
│       └── editor.html
├── .gitignore
├── LICENSE
├── README.md
└── requirements.txt
🧪 Tech Stack
Backend: FastAPI (Python)
Rendering: Graphviz
Frontend: Vanilla JS, CSS3, HTML5
Server: Uvicorn
💻 Analysis
This repository includes a config.yaml for use with pyragify. To generate a single-file codebase for analysis in LLMs like NotebookLM, run: - python -m pyragify --config-file config.yaml
🛣️ Roadmap Features
[ ] SVG Support: Add an option to render as SVG for infinite scaling without pixelation.
[ ] Persistence: Use a database (SQLite) to allow users to save their diagrams and get a unique URL to share them.
[ ] Dockerization: Containerize the app so that Graphviz dependencies are handled automatically regardless of the OS.
[ ] Export to PDF: Generate print-ready documents of the flowcharts.
🤝 Contributions
Reporting Bugs: Open an issue with a clear description and steps to reproduce the error.
Suggesting Enhancements: Have an idea for a new shape or color syntax? Open an issue to discuss it!
Pull Requests: * Fork the repo.
Create your feature branch (git checkout -b feature/AmazingFeature).
Commit your changes (git commit -m 'Add some AmazingFeature').
Push to the branch (git push origin feature/AmazingFeature).
Open a Pull Request.
- Built by Roy Peters